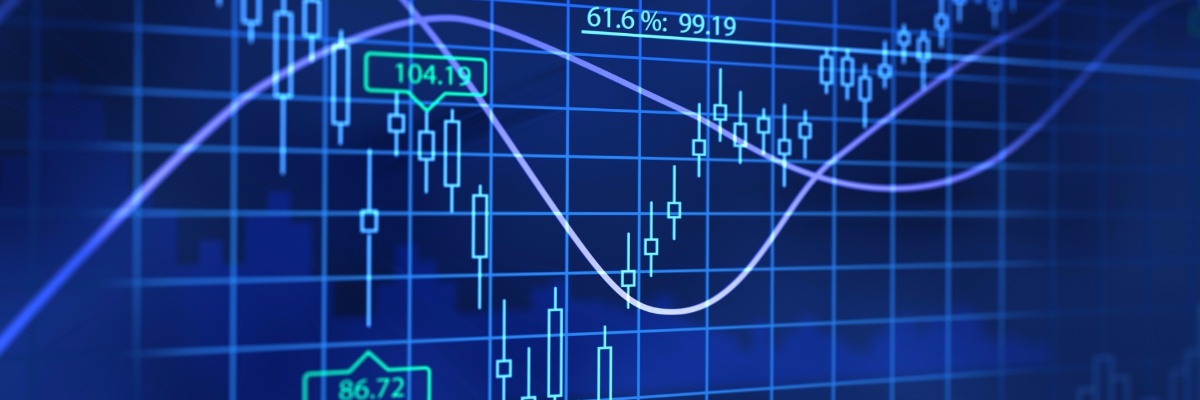
It is widely believed that one of the key factors for success on the stock market - is an inborn talent to trade. However, this is - a profound error. To make a profit of speculation, first of all, you must learn how to analyze the market situation.
In this article, we will tell you, how to catch the mood of the cryptocurrency market with the five most important market indicators. The ability to read charts will allow you to make the right trading decisions, so - to make a profit.
1. "Market Depth"
This indicatore is at almost every cryptocurrency market. It reflects the buy and sell orders ratio. In other words, it allows us to estimate the supply and demand on the market at the moment.
The green line on the chart tells about the volume of applications for purchase, and red - for sale. The current value of cryptocurrency displays the lowest point of the graph.
To find out how much of the purchase or sale cryptocurrency can affect the price change, move the cursor to any point on the graph.
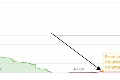
This value indicates, that the price per 1 LTC will be $4,385 if on the stock market will be bought 291.5 litecoins.
Also the graph shows that the greatest number of requests for purchase was 1,744 dollars per litecoin, and for sale - for $5.91.
Analyzing the graph, it is worth to remember that a large number of proposals for the sale, force the price to decrease. It means that with a decrease in prices, it becomes willing to buy more.
2. "Order book"
For more detailed analysis of the market situation, you can use an "order book". The book submitted all orders in a digital form.
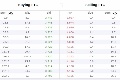
At the left are applications for purchase (Bid), and at the right - for sale (Ask). Also in the table shows the price and volume of placed orders.
An "Order book" gives the trader more market information than the "market depth". The competent analysis will help to predict the future direction of prices and adjust the trading strategy.
3. "The last trades"
For a more complete understanding of the market situation, it is also recommended to pay attention at the indicator «Last trades».
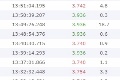
With it you can see a history of all completed transactions - the number, volume and time for which these transactions were carried out. With this indicator, you can anticipate a possible change of mood on the market, to see the purchases of large players. If in the table are dominated applications «Ask» (red), it means that the active player operates the purchase in the market. If the «Bid» (green) - operates an active player on the market.
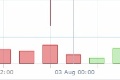
4. The candlesticks
The candlesticks - the most common way to display the price chart. Traders like it for its simplicity and clarity. In contrast with line graphs, candlesticks are more useful for making trading decisions. They allow you to see the picture of the market, as well as - to forecast price movements.
The body of the candle (rectangle) shows the price of opening and closing, and the shade (thin line) - the minimum and maximum of price for a certain period of time (1min, 5min, 15min, 30min, 1h, 4h, 1d).
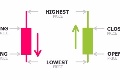
Let's see on the candle below. We can see that the price of open and the highest price of candle in line, reaching $3,930. The closing price was $3,696, and the minimum - $3,625.
In practice, by the shadow of the candle you can assume what will be the future price movement. Generally, the long shadow says about reversal of the course. As usual, after a long lower shadow price will increase, and after a long top - perhaps will fall.
5. The indicator of trading volume
This figure is in the form of columns. Typically, they are located at the bottom of the schedule. The height of each column corresponds to the trade volume for a certain period.
Proper trading volume analysis allows to predict future changes in market sentiment. If the trading volume increases with a further increase in prices, it suggests that the market supports this motion. If the volume of trading with price falls - it indicates about negative attitude to such market trends. In addition, excessively high volume of trading may indicate the imminent change of trend.
In conclusion
If you want trading on the cryptocurrency market bring you profit, you need to combine all your knowledge, skills and intuition together. Try to read as much as possible thematic literature, watch for other market players. Then, after some time, through trials and errors, you will gain invaluable experience that will bring you considerable income.